
If you want to know if your social media is actually working, you have to look past the vanity metrics. Forget just counting likes and followers for a second. Real measurement means digging into a mix of hard numbers (comments, shares, saves) and the softer, qualitative stuff (what are people saying? what’s the vibe?) to see if your content is truly connecting.
This is how you figure out if your efforts are hitting home and, more importantly, helping your business.
Why Measuring Engagement Is No longer Optional
Tracking social media engagement has graduated from a simple ego-boost to a critical diagnostic tool. It’s your best window into your brand’s health and the true impact of your content. These numbers tell a story—what your audience cares about, what gets them talking, and what ultimately moves them to act.
Think of this data as your direct line to your customers. When you get the hang of measuring engagement the right way, you unlock a goldmine of insights that can shape everything from new products to how you handle customer service.
The Shift from Quantity to Quality
The conversation online has definitely matured. It’s not about who can shout the loudest or post ten times a day anymore. The trend is crystal clear: strategy and quality are winning.
Just look at the higher education space. A recent analysis found that institutions posted 15% fewer posts on Facebook but saw their total engagement dip by only 0.5%. This is a huge signal. It tells us that audiences are rewarding more thoughtful, relevant content, even when it shows up less often. You can dig into more of these social media engagement trends on quid.com.
It’s solid proof that a deliberate, value-first strategy can keep your audience hooked without cluttering their feeds.
Productivity Tip: Instead of creating 10 posts a week, focus on creating 5 high-quality ones. Use the extra time to engage directly with your community by replying to comments and DMs. This small shift in workflow can lead to stronger relationships and better overall engagement.
How Engagement Fuels Business Growth
Real engagement is a sign of a healthy, thriving community. It’s the bedrock for hitting your most important business goals. When you make a habit of tracking and analyzing these interactions, you start to see real-world benefits.
- Build Lasting Brand Loyalty: An audience that feels heard and seen sticks around. That connection goes way beyond just making a sale. Example: A skincare brand that consistently answers questions in their comments builds trust, making followers more likely to purchase from them over a competitor.
- Generate Qualified Leads: People who are already engaging with you—commenting, sharing, asking questions—are far more likely to trust you when they’re ready to buy. Example: A real estate agent sharing a “First-Time Homebuyer Q&A” on Instagram gets DMs asking about local listings. These are warm leads.
- Gather Priceless Feedback: Where else can you get unfiltered customer opinions? Comments and DMs are a direct pipeline to what people love (and don’t love) about what you do.
At the end of the day, measuring engagement turns your social media from just another marketing task into a core piece of your business intelligence.
To give you a clearer picture, here’s a quick breakdown of the core metrics you should be watching.
Key Social Media Engagement Metrics at a Glance
This table sums up the essential metrics, what they track, and why each one gives you a different piece of the puzzle.
| Metric | What It Measures | Why It Matters |
|---|---|---|
| Likes | The most basic form of approval or agreement with your content. | A simple indicator of content appeal and reach. |
| Comments | Direct audience feedback, questions, and conversations. | Shows your content is thought-provoking and sparks dialogue. |
| Shares | The number of times users repost your content to their own networks. | A strong signal of value; your content is worth endorsing. |
| Saves | How many users save your post to review later. | Indicates high-value, “evergreen” content that users find useful. |
| Mentions | Instances where your brand is tagged or named by other users. | Measures brand awareness and organic conversation volume. |
| Direct Messages (DMs) | Private conversations initiated by your audience. | A key indicator of high intent, trust, and customer service demand. |
Paying attention to this mix of metrics gives you a much richer, more accurate view of how your content is performing beyond the surface-level numbers.
Decoding the Metrics That Actually Matter

If you really want to measure social media engagement accurately, you have to look past the surface-level numbers. It’s about understanding the why behind every click, tap, and share. Each interaction tells a tiny part of your content’s story, and learning to interpret those signals is what separates a good strategy from a great one.
Sure, Likes give you a quick pulse check on whether your content is hitting the mark. But they’re also the most passive form of engagement. The real gold is in the actions that require a little more effort from your audience.
The Story Behind Each Interaction
Think of every engagement metric as a clue that reveals what your audience actually needs or thinks.
- Comments are your direct line to the community. They show your content was interesting enough to spark a real conversation, not just a mindless double-tap.
- Shares are basically a personal endorsement. When someone shares your post, they’re putting their own reputation on the line for its value. That’s huge, and it expands your reach to new audiences who already trust the source.
- Saves are a dead giveaway that you’ve created something genuinely useful. A high number of saves on an Instagram recipe or a LinkedIn checklist tells you you’ve made a resource people want to come back to again and again.
- Clicks show clear intent. A solid click-through rate on a post linking to your latest blog means your headline and visual were compelling enough to pull someone away from their endless scrolling.
For example, a local coffee shop posts a video of their new seasonal latte. They see 500 likes, which is nice. But they also get 50 Saves (people planning to visit), 20 Comments asking about ingredients, and 10 Shares from local food bloggers. The Saves and Shares are far more valuable indicators of business impact than the Likes alone.
Choosing the Right Engagement Rate Formula
Calculating your engagement rate is a must, but not all formulas are created equal. The two most common methods give you two very different views of your performance, and knowing which one to use—and when—is key. It all comes down to what you’re trying to figure out.
Productivity Tip: Don’t calculate these manually every time. Create a simple Google Sheets or Excel template. Dedicate 30 minutes at the start of each month to plug in the numbers from your analytics tools. This automates the repetitive work, letting you focus on what the data means.
Engagement Rate by Reach (ERR)
This one is calculated as (Total Engagements / Total Reach) x 100. Think of it as the most honest look at how engaging your content was to the people who actually saw it. Because it isn’t skewed by your follower count, ERR gives you a clearer picture of your content’s quality. It helps you see how well a specific post grabbed attention, no matter how the social media algorithm decides to distribute it.
Engagement Rate by Followers (ERF)
Calculated as (Total Engagements / Total Followers) x 100, this metric is all about the health and responsiveness of your follower base over time. I use ERF to track the loyalty of my community. If your ERF starts to dip, it might be a sign that your content is becoming less relevant to your core audience, even if a few posts go viral with non-followers.
Choosing Your Social Media Analytics Toolkit
To really get a handle on social media engagement, you need more than just raw data. You need the right tools to pull it all together, make sense of it, and turn those numbers into decisions you can actually act on. The right analytics toolkit will save you hours of grunt work, freeing you up to focus on strategy instead of staring at spreadsheets.
What works for a freelance social media manager is totally different from what a big agency or a small business owner needs. The trick is finding a setup that fits your budget, team size, and what you’re trying to achieve.
Starting with Native Platform Analytics
If you’re a solopreneur or a small business just dipping your toes into tracking engagement, the built-in analytics on each platform are the best place to start. They’re free, surprisingly capable, and give you all the core data you need without feeling overwhelming.
Meta Business Suite, for example, is a fantastic starting point for anyone managing Facebook and Instagram. It pulls everything into one central dashboard to track the essential metrics for both platforms.
Here’s a peek at the Insights Overview in Meta Business Suite, which gives you a quick summary of reach and how your content is doing.
This dashboard immediately shows you which way your reach is trending and which posts are getting the most love, giving you a quick, actionable snapshot of what’s working.
All-in-One Social Media Management Platforms
Once you start growing, you’ll probably want a more cohesive view of your performance across every channel. That’s when all-in-one platforms like Sprout Social or Hootsuite become absolute game-changers, especially for marketing teams or agencies juggling multiple accounts.
These tools give you a single dashboard to:
- Track cross-channel performance: See how your TikTok engagement stacks up against LinkedIn without flipping between a dozen tabs.
- Generate comprehensive reports: Whip up professional, branded reports for clients or stakeholders in minutes, not hours.
- Schedule content and monitor conversations: They roll your analytics right into your daily workflow, which is a huge productivity boost.
Workflow Example: An agency uses Hootsuite to schedule all client posts for the week. On Friday, they use the reporting feature to automatically generate a PDF summary of the week’s engagement for each client. This saves hours compared to logging into each platform, taking screenshots, and building a report from scratch.
Specialized Tools for Deeper Insights
Sometimes, the standard metrics just don’t cut it. That’s when specialized tools like Socialinsider come in handy. They offer deep-dive competitive analysis and benchmarking, letting you see exactly how your engagement compares to others in your industry. It’s the kind of context the native tools often miss.
When you’re building out your toolkit, it’s also worth exploring dedicated social media monitoring tools to automate your data collection. They help you listen in on brand mentions and industry chatter, adding a rich, qualitative layer to your hard numbers.
By pairing a solid management platform with a specialized analysis tool, you create a powerful system for not just measuring but actively improving your social media engagement.
How to Calculate and Benchmark Your Engagement Rate
Okay, you’ve gathered all your data. Now what? It’s time to turn those raw numbers into something that actually tells you how you’re doing.
Calculating your engagement rate is the key. It’s what lets you compare an amazing post that reached 10,000 people with a smaller, niche post that only reached 1,000. This is how you move from just counting likes to truly understanding your content’s impact.
Two of the most practical formulas I use are Engagement Rate by Reach (ERR) and Engagement Rate per Post (ER Post). Each gives you a slightly different angle on your performance.
The Most Honest Formulas for Engagement
If you want a true pulse on how compelling your content is, start with the engagement rate by reach (ERR). This metric tells you the percentage of people who actually chose to interact with your post after seeing it. It’s my preferred method because it isn’t skewed by follower count—it’s a pure measure of content quality.
The formula is straightforward: ERR = (Total Engagements / Total Reach) * 100.
Think of it this way: ERR answers the question, “Of all the people who saw this, how many cared enough to do something?” You’ll see this play out across different platforms, too. For instance, the average ERR on Instagram hovers around 3.0%, while on Facebook, it’s closer to 1.2%. It just goes to show how different the user behavior is on each network.
Another great metric is Engagement Rate per Post (ER Post), which measures engagement against your total follower count. This is a fantastic way to check the pulse of your dedicated community and see how responsive they are over time. If you want to dive deeper into these calculations, our full guide on what an engagement rate is breaks it all down.
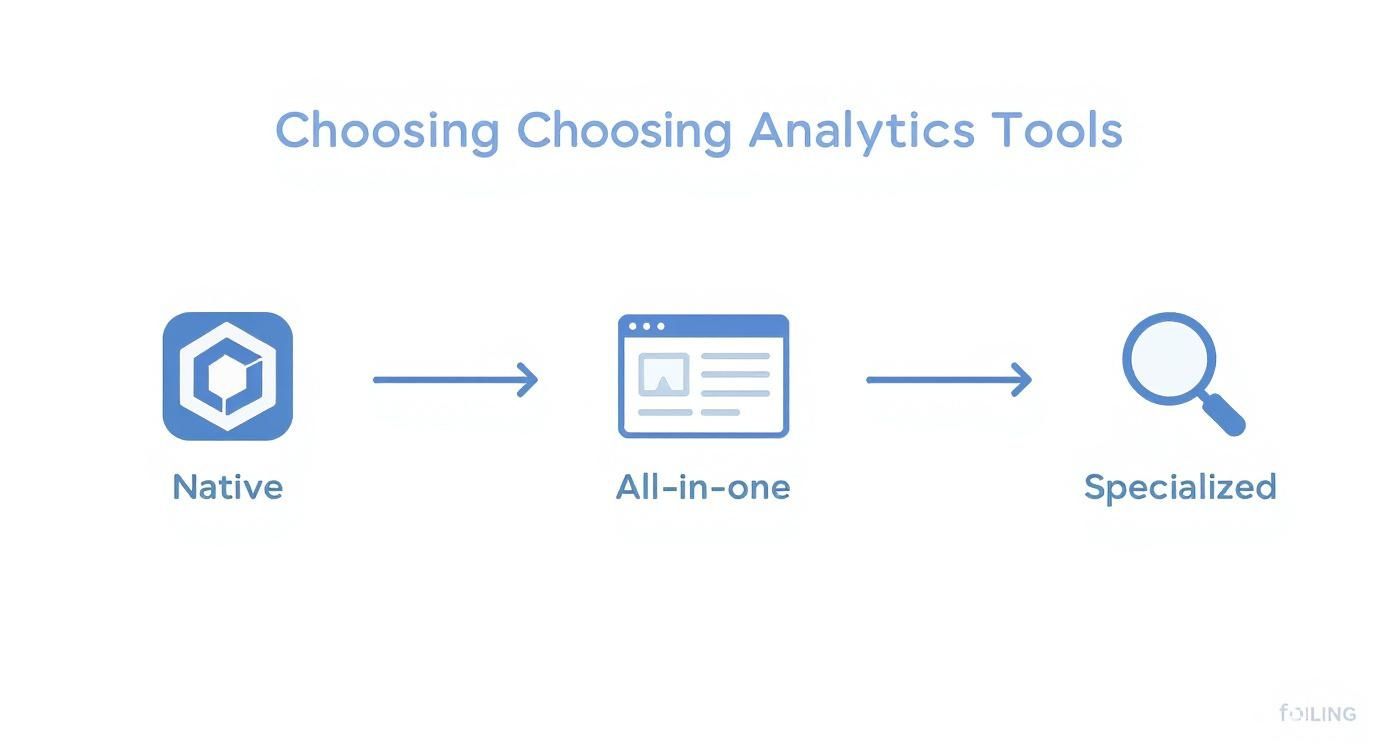
As this flowchart shows, the best analytics tool for you really depends on what you’re trying to achieve. Are you just looking for a quick pulse check, or do you need a deep, granular analysis? Your goals dictate the tools.
Setting Benchmarks That Actually Make Sense
It’s easy to get hung up on generic industry averages, but honestly, they can be misleading. While it’s good to have a rough idea of where you stand, your most important competitor is your own past performance.
The most productive way to benchmark is to track your own average engagement rate month over month. This creates a realistic baseline that accounts for your unique audience, industry, and content style. Aim for steady, incremental growth rather than chasing elusive industry-wide numbers.
Here’s a practical way to start. Go calculate your average ERR for the last 30 days. That number? That’s your starting line.
From there, you can set a realistic goal. Maybe you aim to increase your average rate by 0.5% next month. This internal benchmarking gives you a clear, motivating path forward and helps you prove that your social media efforts are actually working.
If you do want to see how you stack up against others in a specific niche, this guide on what is a good engagement rate on TikTok offers some solid platform-specific insights.
Moving Beyond Numbers to Understand Your Audience
High engagement numbers look great on a report, but they only tell half the story. The real gold is hidden in the why behind those interactions. To really get a grip on social media engagement, you have to look past the what—the likes and shares—and dig into the qualitative side of the conversation.
This is where you discover what your audience truly thinks and feels. Are their comments positive, negative, or just neutral? Are they asking genuine questions or just dropping a quick emoji? Answering these questions is how you turn raw data into a powerful feedback loop for your entire business.
Uncovering the Story in Your Comments
I recommend starting with a simple manual audit. Once a week, pick a high-performing post and just read through the comments. You don’t need fancy tools for this; a basic spreadsheet is all you need to start categorizing what you find.
Imagine a SaaS company analyzing feedback on a new feature announcement. Their spreadsheet might look something like this:
- Positive Feedback: Comments like, “This update is a game-changer for my workflow!”
- Questions: Users asking, “How do I access this on the mobile app?”
- Frustration/Bugs: Posts such as, “Ever since the update, the app keeps crashing.”
- Suggestions: Ideas like, “It would be amazing if this could integrate with…”
This simple audit quickly turns a jumble of comments into actionable insights for your product, marketing, and support teams. It’s how you spot trends before they become major issues.
Using Sentiment Analysis for a Broader View
Manually reviewing every comment is powerful, but it doesn’t scale. That’s where sentiment analysis tools come in. Platforms like Sprout Social or Brandwatch use AI to scan mentions and comments, classifying them as positive, negative, or neutral. This gives you a much higher-level view of your brand’s overall health online.
The goal of qualitative analysis is to add context to your numbers. A spike in mentions is meaningless until you know why people are talking about you. Was it a successful campaign, or is a customer service issue going viral?
It’s easy to get lost in the weeds of engagement metrics, but at the end of the day, it’s about distinguishing between the raw numbers and the human stories behind them.
Qualitative vs. Quantitative Engagement Metrics
| Aspect | Quantitative Metrics (The ‘What’) | Qualitative Metrics (The ‘Why’) |
|---|---|---|
| What It Measures | The volume and frequency of interactions. | The tone, context, and intent behind interactions. |
| What It Reveals | How many people are engaging with your content. | How people feel about your content and brand. |
| Examples | Likes, shares, comments, reach, impressions, clicks. | Comment sentiment, user-generated content, support questions, direct messages, brand mentions. |
Both sides of this table are essential. Quantitative data tells you if your strategy is working, while qualitative data tells you if it’s resonating.
This process also helps you refine your content strategy. The way we measure social media engagement has evolved alongside our understanding of what content formats drive quality interactions. For example, recent data from ZoomSphere shows that on Instagram, static image posts have an average engagement rate of 6.2%, beating Reels at 3.5%. Meanwhile, on LinkedIn, document-style posts can hit a massive 37% engagement rate.
Knowing these nuances helps you create content that doesn’t just get seen but sparks meaningful conversation. By categorizing the types of interactions your best content receives, you can build a more accurate picture of your audience. This information is invaluable for creating and updating the profiles that guide your marketing. If you need a refresher, check out our guide on what is a user persona.
When you combine quantitative data with these qualitative insights, you ensure you’re not just talking at your audience—you’re building a community with them.
Common Questions About Measuring Engagement
Once you start consistently tracking your social media engagement, a few questions always seem to come up. I see them all the time from social media managers, founders, and marketers diving into their analytics.
Getting straight answers can save you a ton of time and help you focus on what actually moves the needle. Let’s tackle the big ones.
What Is a Good Engagement Rate, Anyway?
This is, without a doubt, the number one question. And the honest-to-goodness answer is: it depends. There’s no magic number. A “good” engagement rate is a moving target that changes based on a few key things.
- Platform: An engagement rate of 3% might be fantastic on Instagram, but it would be legendary on Facebook, where the baseline is usually much lower.
- Industry: A passionate community, like one built around vegan cooking, is going to naturally pull in more interaction than a B2B software company. It’s just the nature of the content.
- Content Format: A poll or a giveaway is designed for interaction, so it’ll almost always outperform a standard link post.
Instead of getting hung up on some universal benchmark, your real focus should be on your own performance. The truest sign of progress is improving your own average engagement rate month over month. That’s the win.
How Often Should I Pull Reports?
I get it. The temptation to check your stats every single day is real. But it’s usually counterproductive and a one-way ticket to analysis paralysis. It’s much smarter to find a reporting rhythm that gives your data enough time to show you real patterns.
For most people, this workflow is the sweet spot:
- Weekly Check-ins: Just a quick, 15-minute look to spot any big spikes or duds. This isn’t for deep analysis; it’s just about keeping a pulse on things. Use your platform’s native analytics for this.
- Monthly Deep Dives: This is where the real work happens. Pull a full report to analyze trends, see how you’re tracking against your goals, and find takeaways for next month’s content plan. This is where tools like Sprout Social or Hootsuite save a ton of time.
- Quarterly Strategy Reviews: Use those monthly reports to zoom out. Are your big-picture strategies paying off? Are you hitting larger business goals? This is where you make the bigger, strategic shifts.
Don’t let reporting eat up your strategy time. The point of pulling data is to get actionable insights, not to drown in a sea of numbers. A solid monthly and quarterly cadence is the most productive way to go.
What Are Some Quick Ways to Boost Engagement?
Okay, so you know how to measure social media engagement. Now, how do you actually improve it? The good news is that a few small, tactical tweaks can make a real difference pretty quickly.
- Use Interactive Formats: Start weaving polls, quizzes, and “ask me anything” (AMA) sessions into your content mix. They’re a direct invitation to participate and can give your numbers a nice lift. Example: On Instagram Stories, use the poll sticker to ask “Coffee or tea?” or the quiz sticker to test followers’ knowledge about your industry.
- Reply Consistently and Quickly: Block out time every day just to respond to comments and DMs. When your community feels heard, they’re far more likely to engage again in the future. It’s one of the most powerful things you can do. Productivity Tip: Set aside two 15-minute blocks per day (e.g., 9 AM and 4 PM) solely for engagement. This prevents you from being constantly distracted by notifications.
- Ask Open-Ended Questions: Instead of just dropping a statement, finish your captions with a question that gets people thinking. You’ll get much more thoughtful responses than a simple emoji. Example: Instead of “Here’s our new winter collection,” try “Our new winter collection is here! What’s the one piece you can’t wait to wear?”
These aren’t massive strategic overhauls. They’re small adjustments that can create an immediate and noticeable bump in your engagement.
Ready to stop guessing and start creating content that connects? Postful is the AI-powered social media tool that makes reaching your audience simple. Get curated post ideas and on-demand brainstorming tools to grow your reach consistently and confidently. Join the waitlist at https://postful.ai to secure your early access.